How to use it
- Open Scripture Study, then Analyze, then Reports.
- To start quickly, tap Examples and press Build this on one that interests you.
- Or tap Build a report and choose your Objects, like verses, books, people or talks.
- Under Properties, mark what to group by as dimension and what to count as measure, and add a filter if you like.
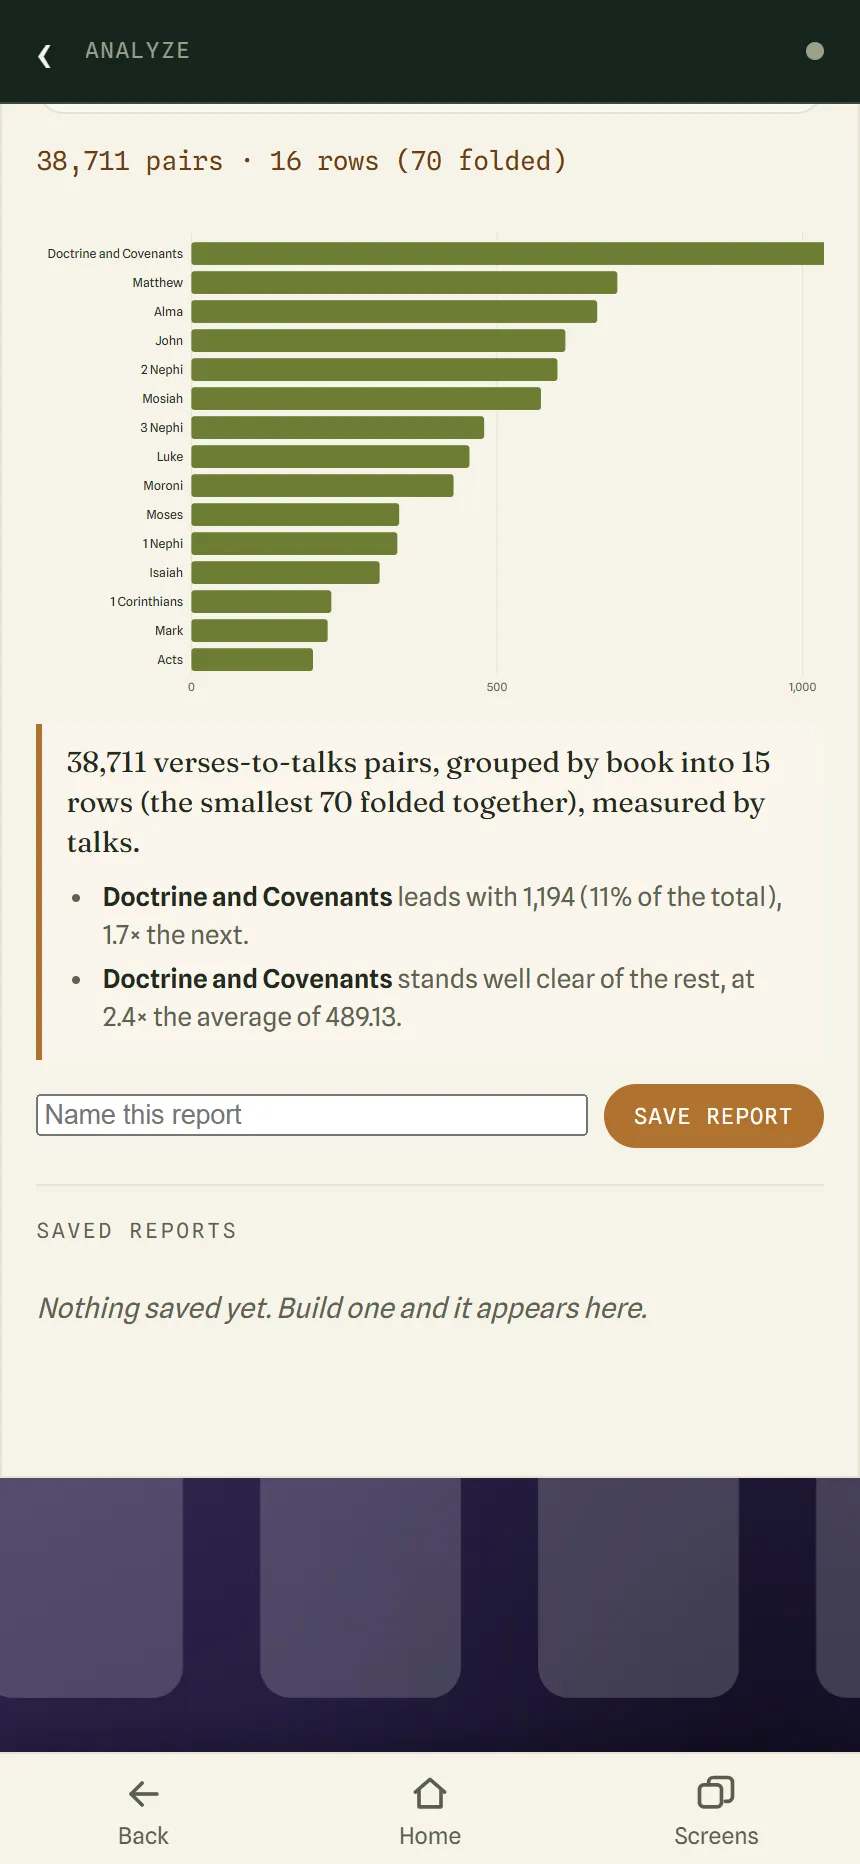
- Pick a Chart, name the report and press Save report. Use Dashboards to put saved reports together.
Good to know
- The examples are real reports you can change, which is the quickest way to learn the tool.
- Some objects, like talks and songs, download the first time you tap them.
- If a chart does not suit the data, the tool says why and shows a table instead.
This is part of Premium. You can open it and look around on a free
account; it asks you to subscribe when you use it. Premium starts with a free week.
See pricing.
Open the app